



Managing rework correctly: save quality and avoid follow-up costs
3. February 2026
Our New Website is Live – More Clarity, Quicker Access to Information
13. February 2026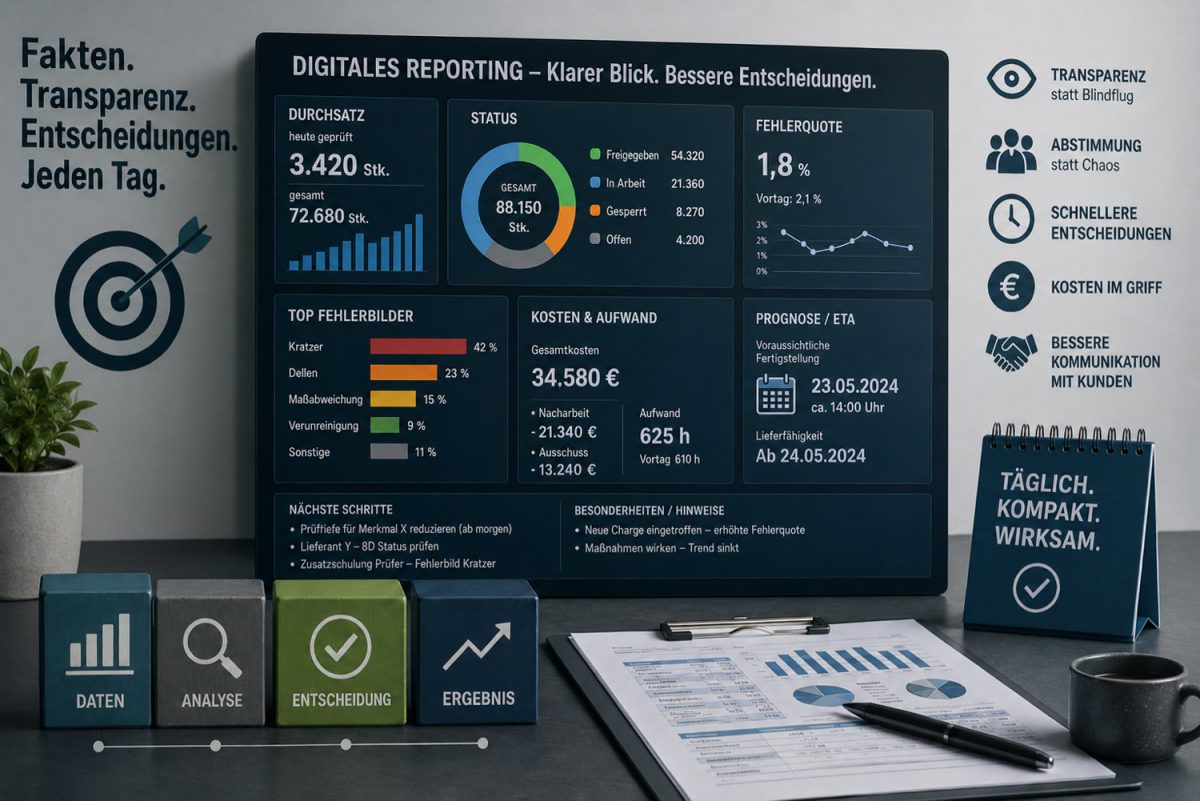
The images on this website were created using artificial intelligence (AI).
In quality assurance, the most expensive problems rarely arise from the defect itself. They arise from the lack of transparency afterward: no one knows exactly what is happening, how far along things are, what it costs, and when delivery can resume. Then coordination loops run, planning is done based on "gut feeling," and the customer receives answers that later have to be retracted.
Digital reporting solves precisely this chaos. Not as an Excel graveyard, but as a daily, clear view of the facts: status, throughput, defect patterns, costs, and next steps. Those who set this up properly make faster decisions, prevent flying blind, and measurably improve customer communication.
What Digital Reporting Really Is
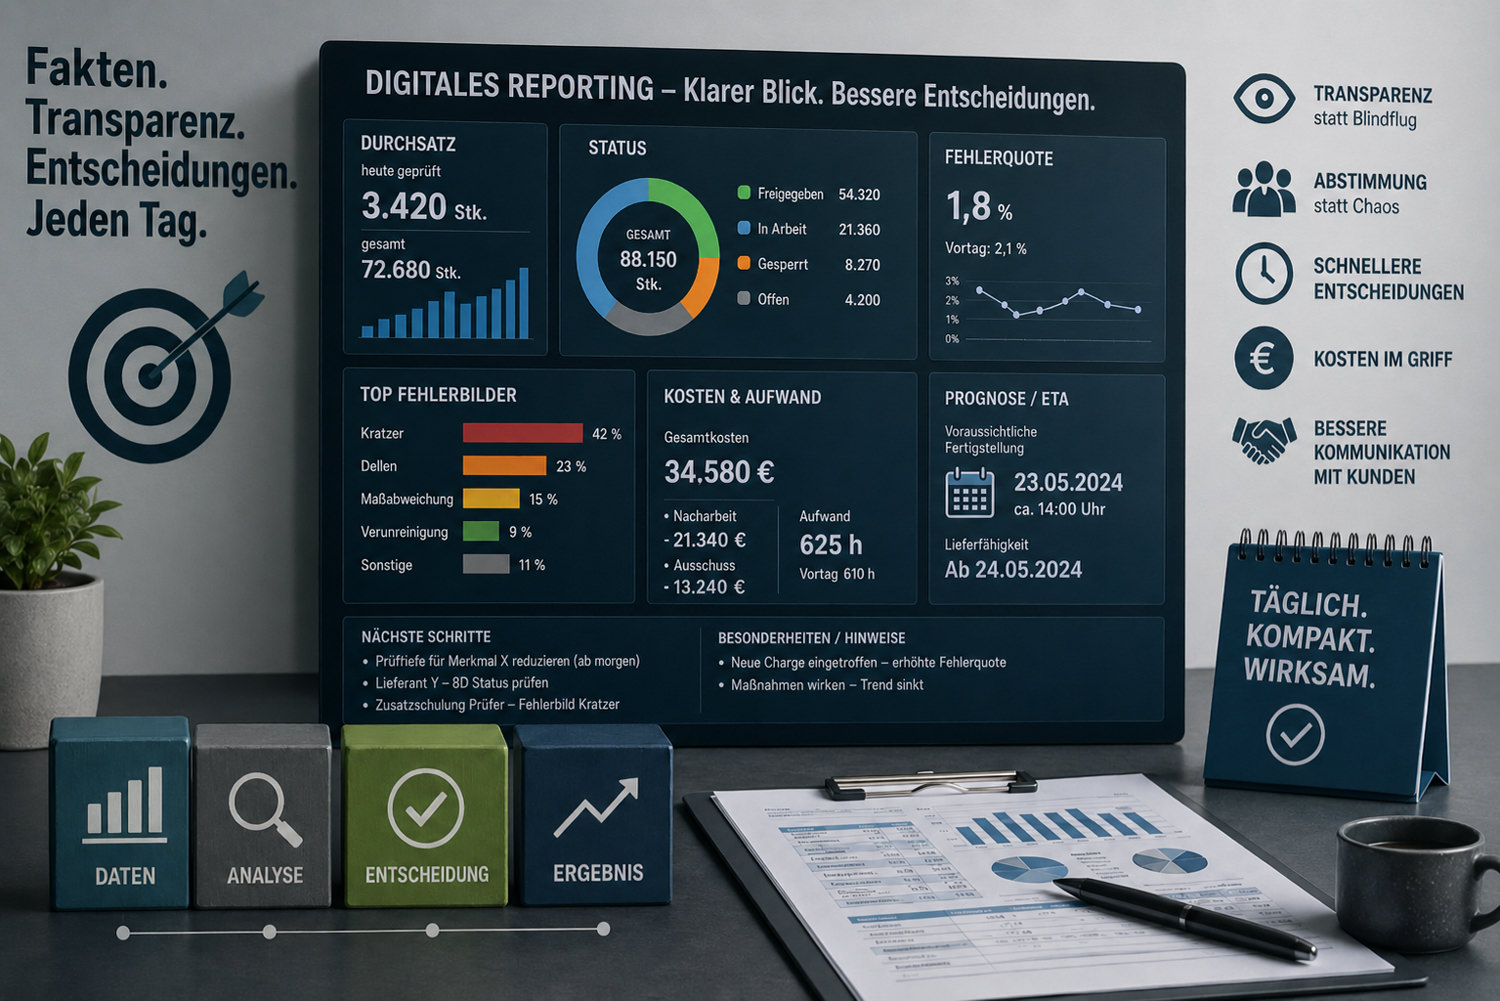
Digital reporting means: you have a reliable, consistent view of the situation every day at the same time. Not "we believe we are at 70%," but: we are at 72%, 3,420 parts inspected today, defect rate 1.8%, main defect X, remaining quantity Y, completion expected on date/time.
This sounds simple. But for many operations, it is the difference between reacting and managing.
Why It Works So Effectively: Three Typical Problem Areas
Without daily figures, almost the same thing always happens:
First, decisions are postponed because no one is certain whether the measure is working. Second, communication escalates because everyone has a different number in mind. Third, costs rise because actions run longer than necessary or are set up too large.
Digital reporting pulls the plug on this. One set of figures per day creates more calm than ten meetings.
Which Metrics Really Matter
You do not need 30 KPIs. You need the few values that enable decisions.
Throughput: How many parts were inspected/reworked today? How many in total?
This allows you to immediately recognize whether the plan is realistic.
Status: What is open, what is in progress, what is released, what is blocked?
This prevents material from lying "somewhere" with no one knowing whether it can be released.
Defect types and defect rate: What occurs and how frequently?
This shows you whether the defect pattern is changing and where you need to take action.
Costs and effort: Hours, shifts, rework vs. scrap.
This allows you to manage whether the measure is still economical or whether you need to change course.
Forecast / ETA: When will we be finished, when can delivery resume?
This is the figure that relieves the most pressure internally and with the customer.
Decisions Become Faster Because They Are No Longer Based on "Gut Feeling"
With digital reporting, the discussion becomes shorter because you are not talking about opinions, but about facts. An example from daily operations:
If the defect rate falls after the first sorting wave, you can adjust inspection depth or personnel. If it remains consistently high, you know: it is not just old inventory, the process continues to produce non-conforming parts. Then you must stop the line, expand the scope, or tighten criteria.
Without daily figures, you often only notice this when the customer complains again.
Customer Communication Becomes Measurably Better
Customers do not want long explanations. They want reliable statements: what is affected, what has already been inspected, what is released, when will goods arrive, and how do you ensure it does not happen again.
Digital reporting delivers exactly that, without drama. And it protects you. Because as soon as you document cleanly, you can prove what was decided and implemented at what point in time.
The effect is noticeable: fewer follow-up questions, fewer escalations, less "please call daily."
How to Set Up Digital Reporting Properly
To prevent digital reporting from becoming busywork, it must be structured:
-
A fixed cadence (daily, same time, same recipient group)
-
Consistent logic and terminology (so everyone means the same thing)
-
A clear data source (so no one "estimates" figures)
-
Versioning (so it is clear what today's status is)
The biggest mistake is doing reporting on the side and then not believing it yourself. Reporting must be simple enough to run reliably.
Common Mistakes That Devalue Digital Reporting
If digital reporting has "not worked" for you so far, it is usually due to these points:
Figures are not comparable because everyone counts differently. Status definitions are vague, making releases unclear. Defect patterns are captured too broadly, so nothing can be derived. Costs are ignored until it is too late. And forecasts are embellished under pressure instead of being calculated cleanly.
This is not meant maliciously—this is everyday reality. But that is precisely why reporting needs clear rules.
Conclusion: Digital Reporting Makes QA Manageable
Quality assurance is ultimately a management issue. When you know what the situation is every day, you make the right decisions faster: adjust inspection depth, manage resources, end or escalate measures, inform customers reliably.
Digital reporting is not additional effort when done correctly. It is the foundation for ensuring that measures do not spiral out of control and that quality, speed, and costs work together.
If you want to set up digital reporting so that it actually works in daily operations, we are happy to support you: structured data collection, clear metrics, clean status model, and evaluations that convince both internally and externally.