


Clarity at all times.
Decide based on facts.
Digital Reporting Around the Clock
In the DQ portal, you can check the status of your quality measure online at any time.
Transparency in the Order
Current results on status, quantities, defect patterns, and costs: clear and up-to-date at a glance.
Inspection Results Clearly Analyzed
Structured reports with key figures and trends: the basis for solution-oriented quality assurance.
Effectiveness Quickly Visible
This makes it transparent in a timely manner whether measures are effective – as a basis for quick and targeted adjustments.
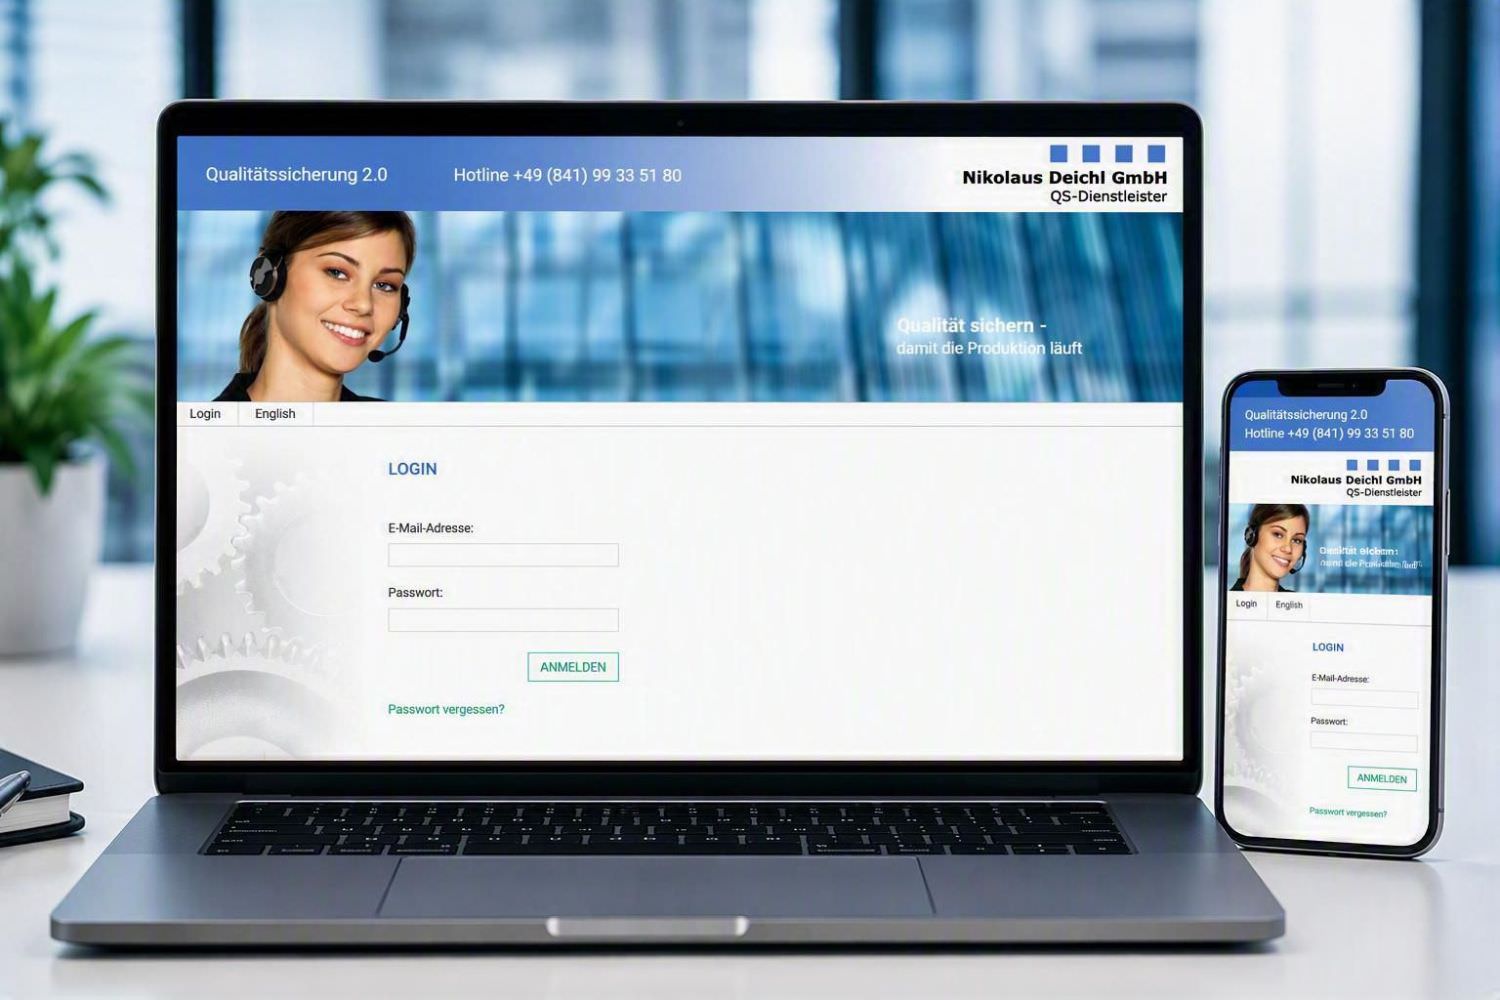
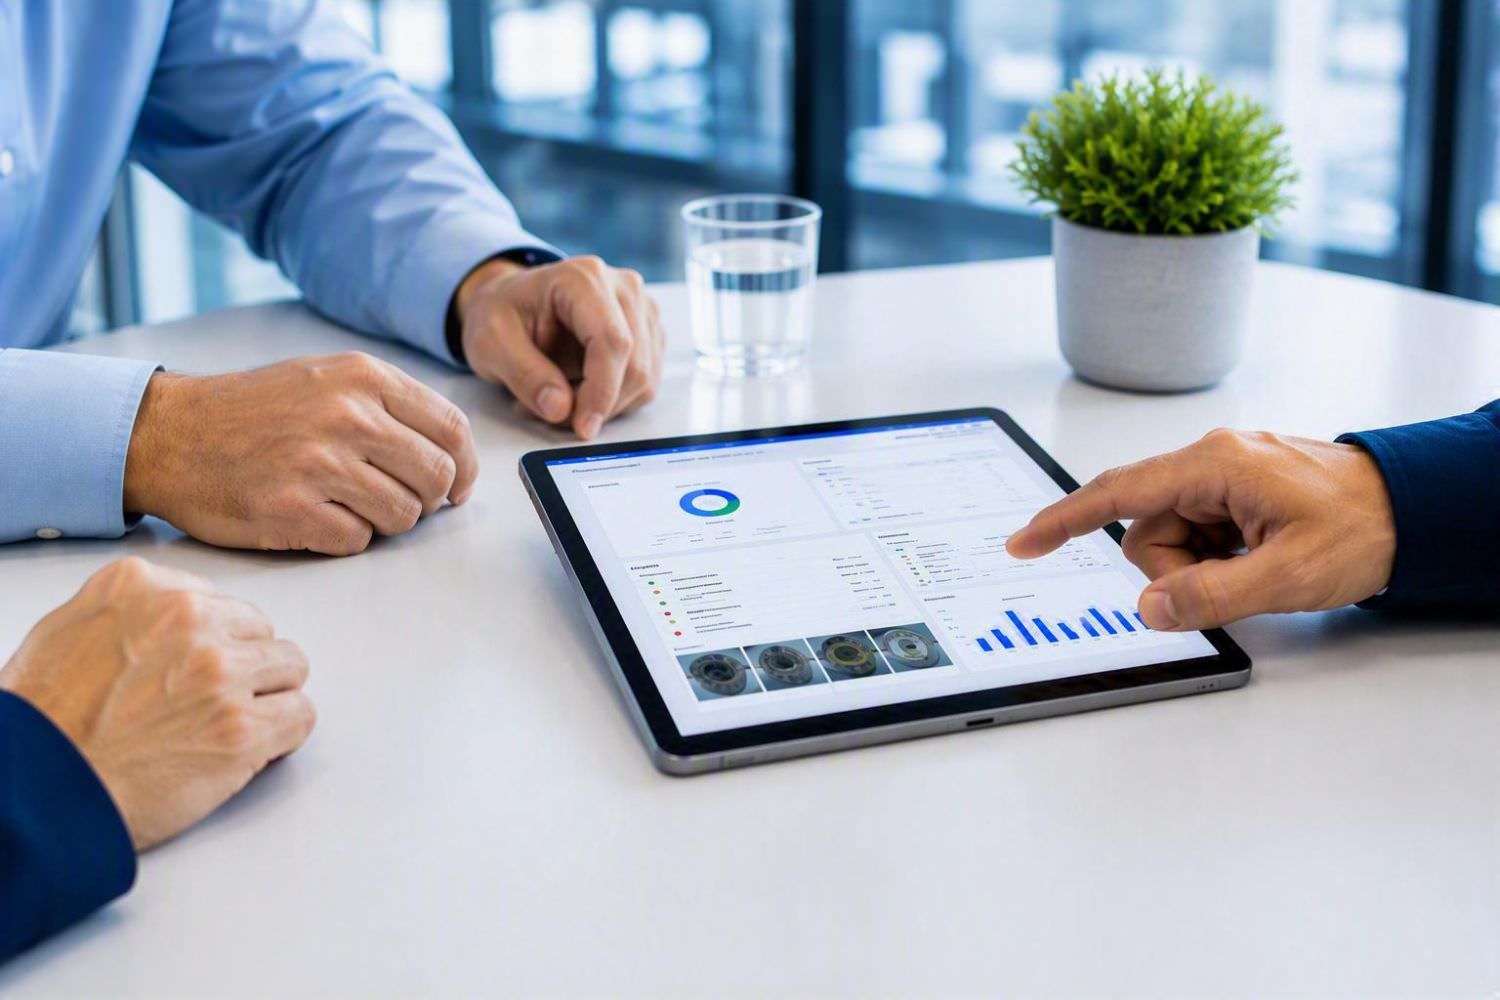


The images on this website were created with artificial intelligence (AI).
Results from the DQ system: comprehensive, continuous, transparent, near real-time, and accessible online at any time. Digital reporting with status, quantities, analyses, and trends – for fewer queries and faster decisions.
Transparency
All orders, statuses, and results are available at any time.
Data Collection
Inspection data is recorded digitally and completely directly at the workstation.
Documentation
All results and documentation are centrally stored and traceably available at all times.
Analysis
Structured data provides clear analyses and trends for quick decisions.
Digital Reporting at Deichl
Quality assurance is only effective if it is controllable. This is precisely what the insights from the DQ system are for: a digital, comprehensive, and continuous reporting system that makes quality measures transparent and accelerates decisions. Through the DQ portal, you have access to all important facts and results at any time – compactly summarized, clear, understandable, and up-to-date: status, quantities, defect patterns, and accumulated costs as decision-making aids for your next steps.
What You Gain (Benefits)
- Fewer queries, less coordination effort
- Faster decisions due to clearer factual basis
- No waiting time due to online access via the DQ portal
- Ability to track the quality measure almost live
- Diverse evaluations, informative reports, and key figures as a basis for decision-making
- Faster verification of corrective actions
- Continuous reporting without media breaks: digital from data collection at the inspection station to retrieval of the analysis in the DQ portal
The Four Modules at a Glance
Status & Progress
Where we stand, how far we are with the processing of the quality measure, what is currently still open.
Quantities & Results
All key figures for performance and results (OK/NOK/rework/scrap and accumulated costs).
Defect Patterns & Trends
Structured presentation of anomalies: defect types, frequencies, development over the entire action period.
Next Steps
Is the corrective action effective, or do you need to intervene? Where is further action required?
.
How Reporting Works
1) Clarification:
Agreement with the customer on which users should have access to the data in the DQ portal.
2) Access Data:
Transmission of access data to the defined authorized persons.
3) Data Collection:
Parallel to the ongoing quality measure, all inspection data is recorded on tablets via DQ-Link and promptly transferred to the Deichl database.
4) Analysis:
Status, quantities, defect patterns, and costs are documented in systematically structured inspection reports. Trends and developments become visible through various analyses.
5) Digital Reporting:
Via the DQ portal, you have easy access to all facts and results at any time.
When This Is Particularly Important
-
For recurring defect patterns that need to be quickly contained
-
Under time pressure, near the production line, or with high delivery obligations
- When multiple departments need to be informed (QA, Production, Logistics, Purchasing)